
Mermaid Diagrams
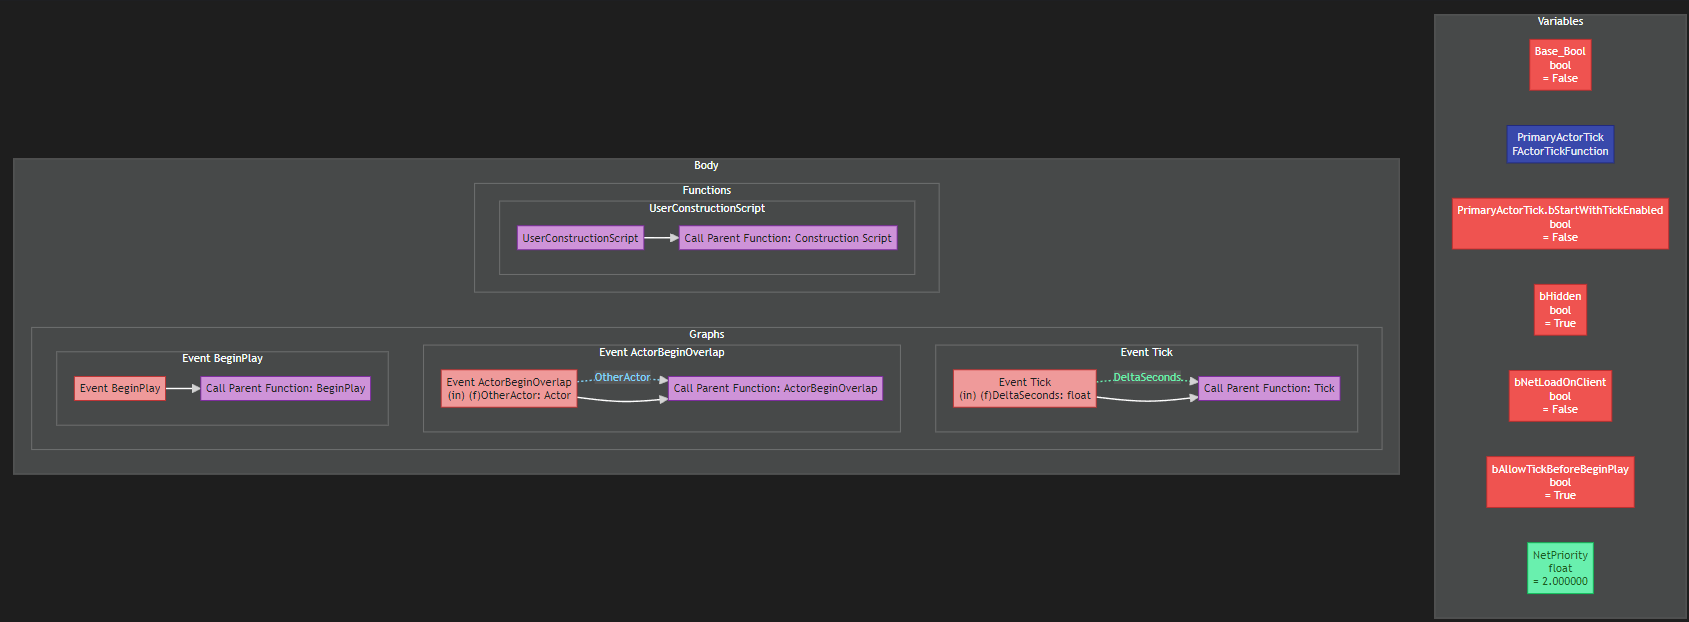
Mermaid turns Blueprint graphs into flowchart diagrams that render in GitHub, GitLab, Notion, and many other tools, no screenshots needed.
What you get
Section titled “What you get”Exporting to Mermaid produces a .mmd file containing a flowchart TB diagram. Paste it into any Mermaid-rendering
page (or mermaid.live) and it becomes a visual flowchart of your graph.
The diagram is structured in three areas:
- a Variables subgraph (
SG_VARS), one node per variable, labeledName<br/>Type<br/>= value, - a Body subgraph (
SG_BODY) holding a Functions subgraph (SG_FUNCS) and a Graphs subgraph (SG_GRAPHS), - node colors via
classDefs (event/call/struct/switch…) and variable-type colors (v_bool,v_float, …) assigned withclassstatements.
A condensed real export (from the example content shipped with the plugin, DA_Test.mmd, a DataAsset with no
graphs, so the body shows the empty placeholders):
%% DA_Test%% Parent: PDA_BaseAsset_C%% Layout: Variables (top) | Functions (left) | Graphs (right)%% Soft node colors via classDef; exec edges white; data edges match variable type legendflowchart TB subgraph SG_VARS["Variables"] direction LR VAR_Base_Bool["Base_Bool<br/>bool<br/>= True"] VAR_Base_String["Base_String<br/>FString<br/>= PDA_BaseString"] VAR_Base_Int["Base_Int<br/>int32<br/>= 12"] end subgraph SG_BODY["Body"] direction LR subgraph SG_FUNCS["Functions"] direction TB FN_EMPTY["(no function graphs)"] end subgraph SG_GRAPHS["Graphs"] direction TB GR_EMPTY["(no event graphs)"] end end classDef n_event fill:#ef9a9a,stroke:#c62828,color:#212121 classDef v_float fill:#69f0ae,stroke:#00c853,color:#1b5e20 %% ... (the full color table for node and variable classes) class VAR_Base_Bool v_bool class VAR_Base_String v_string class VAR_Base_Int v_intFor Blueprints with graphs, the body subgraphs contain the actual flow: exec edges between nodes (-->), labeled
data edges (-.->), and the same color classes. Widget Blueprints add a SG_WIDGETS subgraph with the nested
widget hierarchy, and Widget animations get an SG_ANIMS subgraph. Rendering the file on GitHub or mermaid.live
gives you the diagram.
Where Mermaid renders
Section titled “Where Mermaid renders”- GitHub, in READMEs, issues, and PRs via
```mermaidfenced blocks - GitLab, same syntax, same result
- Notion, pasted Mermaid blocks
A note on readability
Section titled “A note on readability”Large graphs get hard to read as diagrams. The export dialog warns you when a Mermaid export exceeds your configured Mermaid Warn Node Count and suggests Markdown. For reading the details of a graph (pin values, defaults, exact calls), use the Markdown output instead it’s more precise. Think of Mermaid as the picture and Markdown as the spec.