Graphify Installation
Feed a GraphScribe Graphify export into the graphify CLI to get a clustered knowledge graph plus an
interactive HTML page (graph.html) that visualizes every Blueprint, DataAsset, and the
calls / defines / uses links between them.
GraphScribe already emits graphify-shaped JSON (nodes + edges with stable bp: / fn: / evt: / cls: ids,
see Graphify: AI-Ready Graphs). A Graphify batch export also writes the thin
graphify-ready wrapper (graphify-out/graph.json) the CLI expects, so graphify cluster-only does the rest:
community clustering, a written report, and the HTML viewer.
The graphify CLI is a separate, optional tool. It is not shipped with the plugin. The editor can auto-run it after a Graphify export (see Project Settings). Everything below also works standalone outside the Unreal editor.
1. Export Graphify JSON from the plugin
Section titled “1. Export Graphify JSON from the plugin”Use the batch export (Content Browser folder right-click → Export Blueprints with GraphScribe…) and choose Graphify as the format. The output folder gets:
| File | Meaning |
|---|---|
Graphify/ProjectLinkage.graphify.json | The merged project graph. Every asset plus cross-asset calls / defines / uses edges. This is the file you feed to graphify. |
Graphify/graphify-out/graph.json | The graphify-ready wrapper written automatically for the CLI (no converter step). |
Graphify/<ContentRoot>/<AssetPath>/*.graphify.json | One per-asset export (graphify consumes the merged file, not these). |
Re-exporting the folder rebuilds ProjectLinkage.graphify.json from every per-asset file, so folder-by-folder
exports accumulate into the same graph.
2. Install the graphify CLI
Section titled “2. Install the graphify CLI”uv tool install graphifyyThis provides graphify (and graphify-mcp) on your PATH. This guide was verified against v0.9.48.
3. The graph.json wrapper (automatic)
Section titled “3. The graph.json wrapper (automatic)”The graphify CLI reads its own graph format: a graph.json with nodes and links (plus a few top-level metadata
keys). GraphScribe’s export already carries the same node/edge schema, so the only missing piece is a lossless
wrapper and the plugin writes it for you:
A Graphify batch export now writes
Graphify/graphify-out/graph.jsonautomatically next toProjectLinkage.graphify.json(no converter step, no CLI required for this part).graphify cluster-only .consumes it directly.
Field mapping
Section titled “Field mapping”ProjectLinkage.graphify.json | graphify-out/graph.json | Notes |
|---|---|---|
nodes[] (top-level) | nodes[] | Copied unchanged (id, label, file_type, source_file, optional source_location / kind / nativeFunction) |
edges[] (top-level) | links[] | Copied unchanged (source, target, relation, confidence, source_file) |
| N/A | directed | true GraphScribe edges are directional (source → target) |
| N/A | multigraph | false |
| N/A | graph | {} (graph attributes, unused) |
| N/A | hyperedges | [] GraphScribe emits no hyperedges |
| N/A | built_at_commit | Optional, best-effort from the enclosing git repo so the report shows freshness |
4. Generate the page to view the links
Section titled “4. Generate the page to view the links”Run cluster-only from the Graphify folder. It re-clusters the graph, writes the report, and generates the HTML
page:
graphify cluster-only .In the editor: with Project Settings → Plugins → GraphScribe → Generate Graphify Viewer enabled (off by default), a Graphify batch export runs
graphify cluster-onlyin the background and shows a toast when the viewer is ready. The batch dialog also gets an Open Graphify Viewer button for the last Graphify export. If the graphify CLI is missing, the export still completes and the log suggestsuv tool install graphifyy. Set GraphifyCliPath if the CLI is not on PATH.
cluster-only reads <path>/graphify-out/graph.json, re-clusters it into communities, and writes:
| Output | What it is |
|---|---|
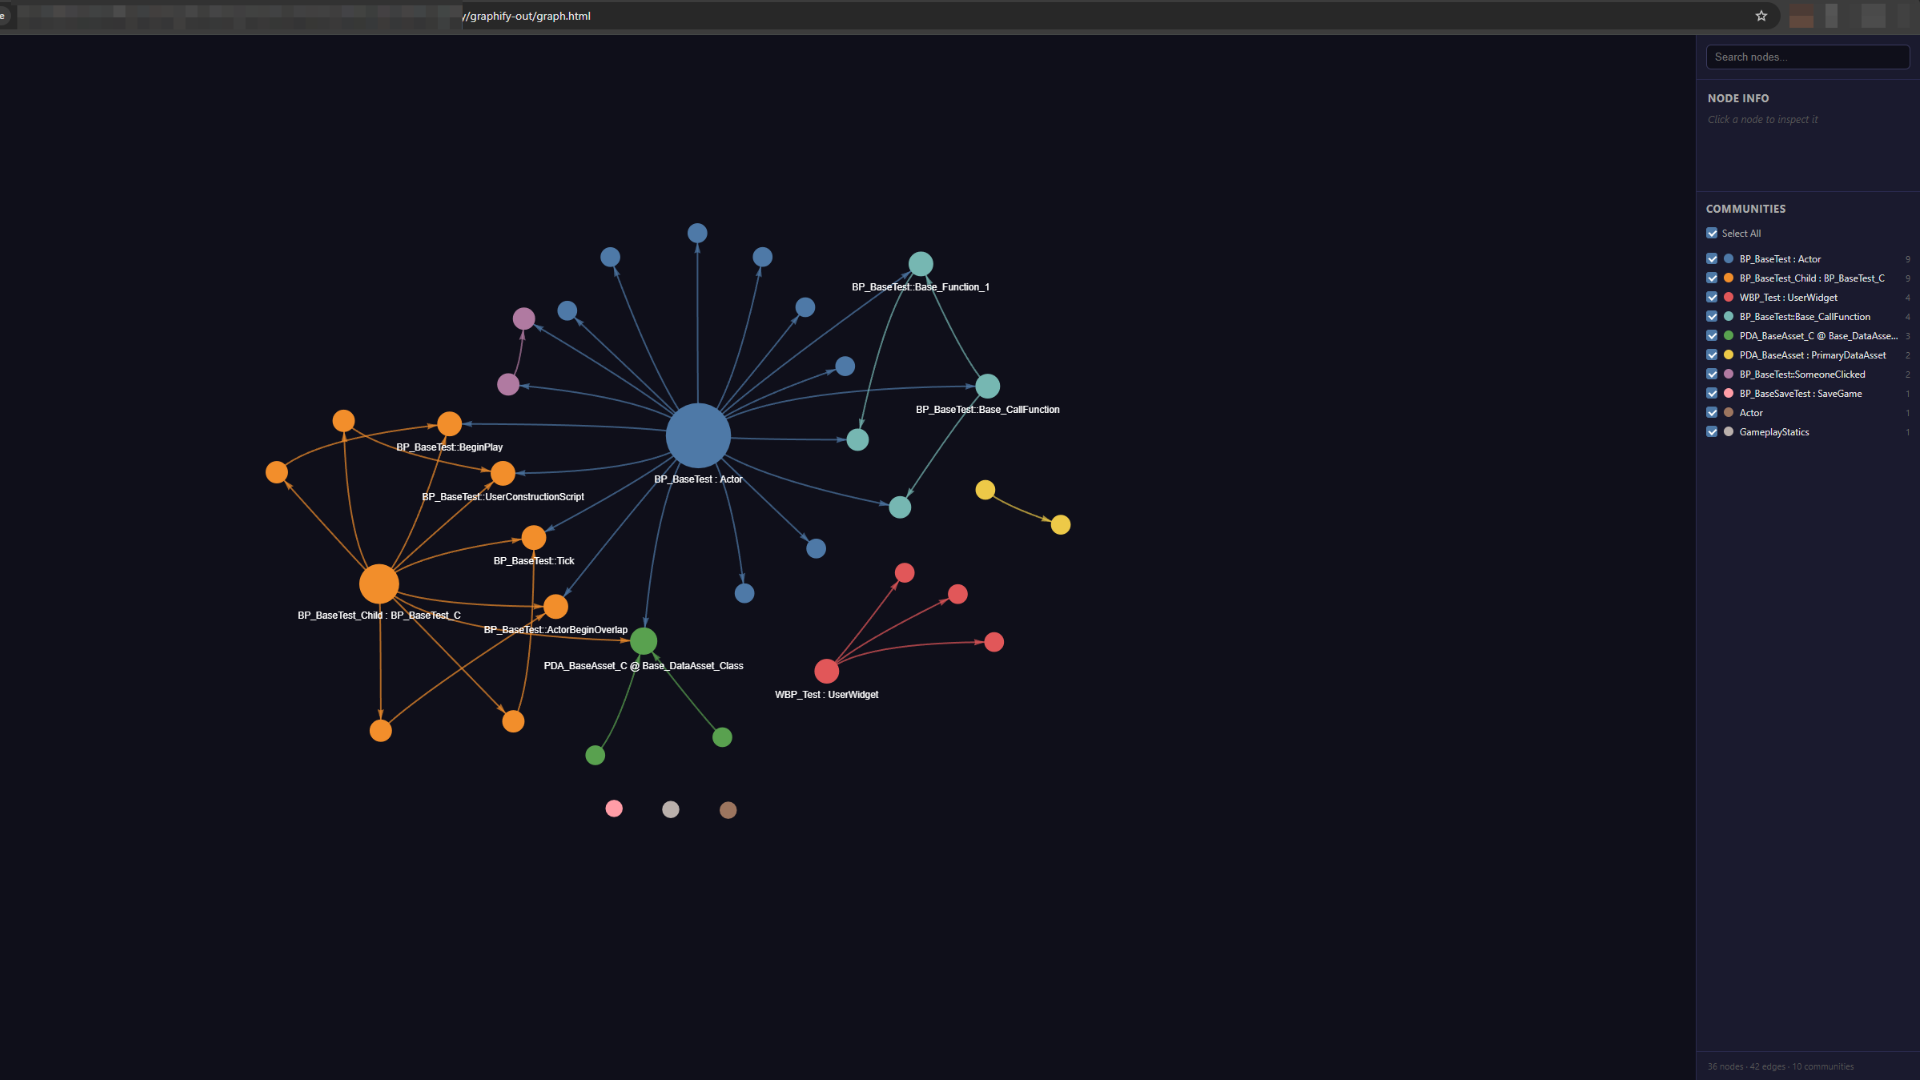
graphify-out/graph.html | The page to view the links. Interactive node/link viewer (open in a browser) |
graphify-out/graph.json | The re-clustered graph (nodes gain community / community_name / norm_label) |
graphify-out/GRAPH_REPORT.md | Written report: node/edge counts, community hubs, god nodes, surprising connections, import cycles |
graphify-out/.graphify_analysis.json | Machine-readable communities / cohesion / god nodes / surprises / questions |
graphify-out/.graphify_labels.json (+ .sig) | Community labels (deterministic hub names by default) |
graphify-out/<date>/ | Backed-up previous artifacts (one dated snapshot per run) |
Useful flags:
--no-labelkeepCommunity Nplaceholders (skips naming entirely).--no-vizskipgraph.htmlfor very large graphs (>5000 nodes) or CI.--backend <name>/--model <name>community names via an LLM backend. Without a backend, labels default to each community’s hub node, deterministic and free.
5. Read the page
Section titled “5. Read the page”Open graphify-out/graph.html in a browser. It is a self-contained page (vis-network, no build step):
- Nodes: One dot per Blueprint / DataAsset / function / event / class, sized by degree, colored by community.
- Edges: Labeled with the relation (
calls/defines/uses) and confidence, click any edge for details. - Search: Type to find a node by name.
- Node info: Click a node for its source file, community, and neighbor list, click a neighbor to navigate.
- Community legend: Checkbox to isolate each community, Select All resets.
- Footer: The totals (
41 nodes · 47 edges · 14 communitiesin the example project).
6. Ask an AI assistant (optional)
Section titled “6. Ask an AI assistant (optional)”The same workflow powers a coding assistant instead of (or alongside) the HTML page. Register Graphify with your
assistant so it can read graphify-out/graph.json and answer project questions:
graphify install # auto-detect Claude Code / Cursor / Codex / Gemini CLI / ...graphify install --platform claude # or name the platform explicitlyThen ask your assistant questions like “Who calls Base_Function_2?” or “Which Blueprints use
PDA_BaseAsset?” The answers come from the real exported linkage, not from .uasset binaries. The exported
documents carry the format contract schemaVersion: 2, generator: "GraphScribe", generatorVersion: "1.1.0",
and the node/edge shape documented in Schema & Stability.
Going further
Section titled “Going further”The same graph.json powers graphify’s read commands:
graphify query "who calls BP_BaseTest::BeginPlay?" # scoped subgraph for a questiongraphify path "BP_BaseTest" "PDA_BaseAsset" # dependency path between two nodesgraphify explain "BP_BaseTest" # plain-language node + neighborsgraphify god-nodes # most connected (architectural hubs)graphify tree . # GRAPH_TREE.html: collapsible D3 treegraphify export callflow-html # Mermaid-based architecture/call-flow HTMLRun these from the Graphify export folder (the folder that contains
graphify-out/). The CLI resolvesgraphify-out/graph.jsonrelative to the current directory. Running from insidegraphify-out/fails with a doubled path. Alternatively pass the graph explicitly:graphify explain "X" --graph <path-to-graph.json>.
- Keep the graph fresh: re-exporting Graphify in the editor rewrites
graphify-out/graph.jsonand (with Generate Graphify Viewer on) re-runsgraphify cluster-onlyautomatically. Outside the editor,graphify cluster-only .does the same. The report stamps the git commit the graph was built from. - Parallel edges collapse:
cluster-onlybuilds a plainDiGraph, so edges that share the same(source, target)collapse to one, in the example,BP_BaseTestbothcallsanddefinesseveral of its own functions, and its 52 export links become 47 graph edges. - Where graph.json must live:
graphifyexpectsgraphify-out/graph.jsonrelative to the path you pass. The plugin writes it there by construction. - Exact node tracing:
explain "<unique label>"returns one node with its exact neighbors (who defines it, who calls it, what it calls).queryfuzzy-matches and can return a superset of start nodes, filter by the unique nodeid(bp:/fn:/evt:/cls:) when you need precision. - The graphify CLI never touches your
.uassetfiles, it only reads the exported JSON.